Customer Experience Rating Survey
ux research @ OpenGov
TIME SCOPE:
2 months
QUANT METHODS:
︎ Survey
︎User Analytics
︎Content Analysis
Keywords: GovTech, Voice of Customer, Democratized Research
BACKGROUND + GOAL
Understanding User Attitude and Measuring Satisfaction
OpenGov’s users mostly work in local governments across the US, and the UX and product teams would like to know how satisfied our users are with our product suites, and how might we improve their experiences.
A customer satisfaction survey has been deployed for the first time not long ago, and I assisted the UX team in analyzing a new batch of insights and evaluate whether the survey is doing in terms measuring user saisfaction towards our products.
The project is two-fold, with the following goals:
1. Understand our users’ general attitude towards our products and surface persistent pain points and areas of dissatisfaction.
2. Set up reliable metrics and collect targeted feedback that measure satisfaction over time.
2. Set up reliable metrics and collect targeted feedback that measure satisfaction over time.
METHOD
Survey: Quantitative Measures + Content Analysis
Surveys are great for collecting responses from a large sample, and it can also quantify user attitudes and track their experiences longitudinally. It can also yield both quantitative and qualitative data, so it’s perfect for reliably measuring and tracking changes in user perception of the products over time, while leaving room for open-ended feedbacks.
The types of data intended to be collected from this survey include:
- A numeric score on satisfaction, on a likert scale of 7 (quantitative)
- Open-ended comments (qualitative)
Some basic quantitative analysis will be conducted along with other user/entity-specific metadata, and the qualitative data will be analyzed through coding and tagging.
Recruitment + Survey Design
While our users are mainly employees of local governments, we have to work with a limited pool of eligible research participants who fit our target user profile. For the purpose of this survey, we directly recruited participants through Pendo, our analytics platform, through setting up filters with desired user segmentation and directly deploying the survey into our product.
The survey was first deployed in April, and an inaugural report was published to the company based on the analysis of an initial batch of insights. For the second batch of responses, a total of 226 scores was collected, along with 56 comments.
FINDINGS
Improvements in Usability and Support
Usability remains to be an area of top relevance among all feedback. There was a reduction of mentions of defects like system slowness compared to report of insights last time (though this is partially impacted by the research design and sampling mechanism), while complaints about difficulty navigating the product still remains. Customer support is hugely appreciated and helpful, especially when users run into problems or can’t complete their desired tasks at hand.
Issues with Transition from Legacy Solution
With the launch of a new product suite, the survey responses highlighted some issues in this process, including problems with deployment and transition from a legacy solution. While our users appreciate the support they have received, they are hoping to see more improvements going down the road.
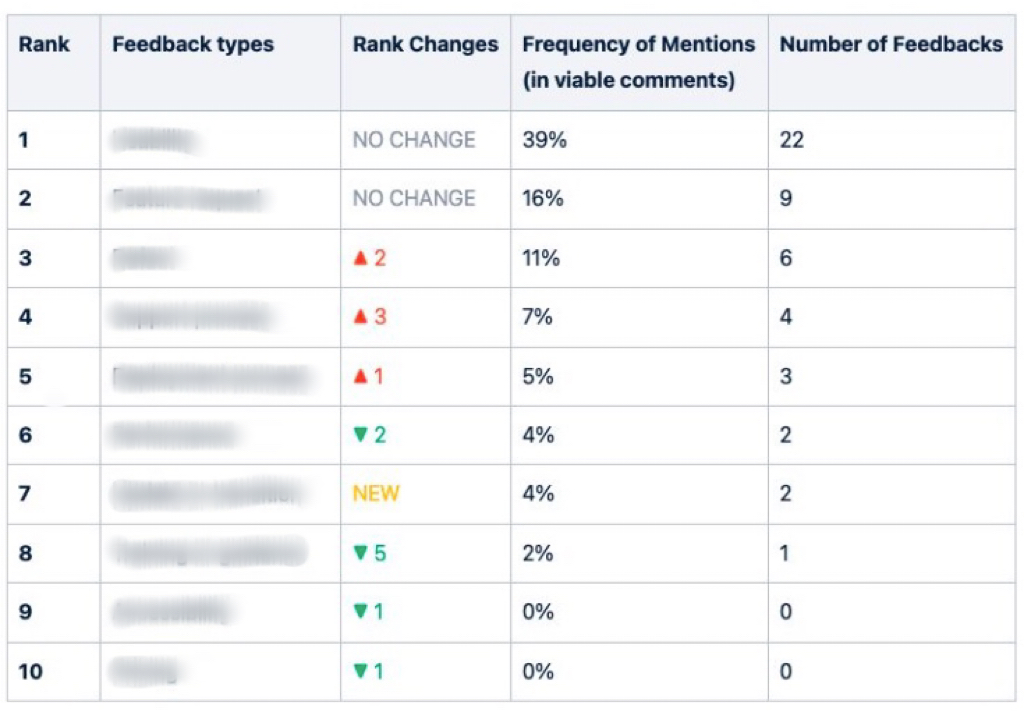
Tracking Changes over Time
I also compiled a table that tracks changes in the type of feedback we are getting, compared to the last report (shown below). There were slight fluctuations in the order of frequently mentioned types of feedback, though the top two most commonly mentioned remained unchanged.
IMPACT
Upon sharing some preliminary findings with the UX team, I recognized that certain findings validated a few of the features that were under planning in the pipeline. These insights, along with areas for improvement, were highlighted in a report I shared in our monthly UX newsletter to the whole company.
The report included a short overview of changes in trends and a link to a longer presentation with more detailed product-specific analysis and recommendations, which included visualized data by user segmentation that‘s aligned with key product strategy, and PMs were actively engaged in posing follow-up questions.
The report also sparked a discussion around measuring satisfaction with reliable metrics among senior leadership, and following the newsletter share-out, I worked closely with Dor, our Director of Design, to draft an updated survey to measure satisfaction with more tailored metrics.
As a result, I continued to work on the Customer Experience Rating survey and redesigned it with the goal to capture user attitudes toward our products in a more targetted manner, incorporating key metrics that represent diffferent aspects of the user experience of our products.
REFLECTION
Some of the biggest challenges and learnings I’ve encountered through this experience revolve around the challenge of integrating research into product strategies and lifecycle. I approached these challeges through crafting relevant and easy to understand metrics, reporting research insights to various audiences in tailored communications, and maintaining a close working relationship with stakeholders who are close to and familiar with product strategies throughout the process.
Validated Product Decisions + Stakeholder Engagement
Upon sharing some preliminary findings with the UX team, I recognized that certain findings validated a few of the features that were under planning in the pipeline. These insights, along with areas for improvement, were highlighted in a report I shared in our monthly UX newsletter to the whole company.
The report included a short overview of changes in trends and a link to a longer presentation with more detailed product-specific analysis and recommendations, which included visualized data by user segmentation that‘s aligned with key product strategy, and PMs were actively engaged in posing follow-up questions.
Follow-up Discussions around Metrics
The report also sparked a discussion around measuring satisfaction with reliable metrics among senior leadership, and following the newsletter share-out, I worked closely with Dor, our Director of Design, to draft an updated survey to measure satisfaction with more tailored metrics.
As a result, I continued to work on the Customer Experience Rating survey and redesigned it with the goal to capture user attitudes toward our products in a more targetted manner, incorporating key metrics that represent diffferent aspects of the user experience of our products.
REFLECTION
Integrating Research into Product Strategies
Some of the biggest challenges and learnings I’ve encountered through this experience revolve around the challenge of integrating research into product strategies and lifecycle. I approached these challeges through crafting relevant and easy to understand metrics, reporting research insights to various audiences in tailored communications, and maintaining a close working relationship with stakeholders who are close to and familiar with product strategies throughout the process.
Contact me for access to more in-depth details about this project.